
As defenders we continue to look for new ways to enhance detection to be able to face the challenges posed by attackers and security researchers innovating and publishing their results. For this reason it is important to develop a detection plan with an attacker’s mindset and invest time into development of new hypotheses.
With the idea of providing content on low-level detections, in a previous blog post we published some ways to detect shellcodes using:
- EPT hooking
- Kernel callbacks to monitor loaded libraries
In both of the above scenarios we tried to detect artifacts during the loading process. In order to be proactive in our detection plan, the following question arises:
What if we were not able to detect this loading process or the payload did not need to be allocated new memory?
Post-exploitation tooling is becoming increasingly sophisticated and often evades detection by EDRs, so it makes sense to assume that we will not be able to detect every time an attacker is able to load his code into memory.
In this blog post, we will show a way to detect artifacts that are already loaded in memory from kernel and in real time. To illustrate the detection method, we will focus on two typical techniques used by attackers:
- Direct system call
- Manual mapping code
Our idea of detection is to monitor every system call of the system and check if we can detect any of the above techniques. The reason we do this is because once the payload has been loaded into memory, it will usually need to make system calls to interact with the operating system. Below we will explore what we need to implement our detection plan
Syscall Monitoring
Windows 10 19H1(build 1903) introduced the ability to consume ETW events related to syscalls monitoring from the kernel in real time via callbacks. Alex Ionescu explains the details in the following article. Unfortunately, this feature is only available if kernel debugging is enabled.
There is also the possibility of consuming ETW events from user space but it would be easier for attackers to blind the consumer or patch ETW loggers as ntdll!EtwEventWrite, advapi32!EventWrite or even ntdll!NtTraceEvent.
Knowing this, we are going to opt for a more experimental alternative to monitor system calls in real time, we are going to use InfinityHook. It’s a project that is used for offensive purposes to be able to hook syscalls at kernel level bypassing KPP. You can see a detailed explanation of the project in its github repository.
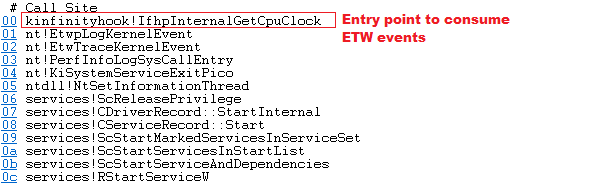
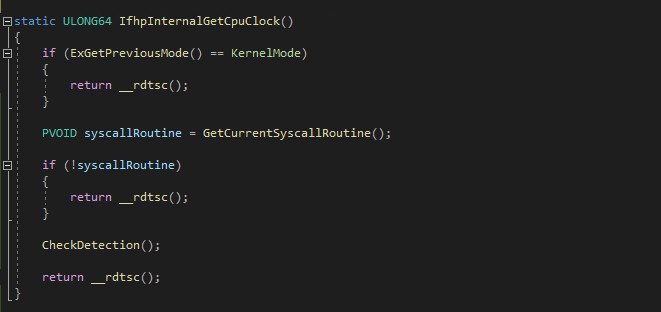
A quick summary of how InfinityHook works: it enables syscall monitoring through ETW and intercepts the control flow of the ETW, overwriting the pointer stored in the GetCpuClock field of the WMI_LOGGER_CONTEXT struct. The new pointer stored in GetCpuClock is the hook handler that is going to be our entry point to consume ETW events on kernel mode. So looking at the InfinityHook code, our entry point to consume ETW events will be the IfhpInternalGetCpuClock() function. At this point, we will need to obtain the information from the syscall and report some type of detection mentioned above if necessary. You can see an example in the following image:
Direct System Calls Detection
EDRs usually monitor the use of system calls in user space to detect potentially malicious actions. Direct System Calls is a technique to evade syscall monitoring. You can find a detailed explanation here.
To summarize, the idea of Direct System Calls is to call the syscall directly without using the stub for this purpose. Thus, EDRs will not be able to monitor system calls using the hooks placed in the stub.
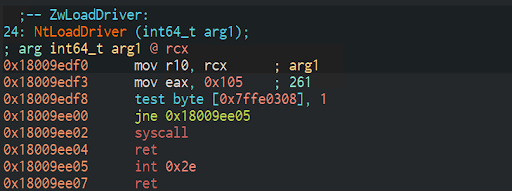
If we disassemble ntdll.dll, which is one of the stubs that the system uses to communicate with the kernel, we can see how is the original code used to invoke the system call:
Having understood how the evasion technique works, let’s see how we can detect it. There is previous work that uses the Instrumentation callback to detect this evasion technique from user mode.
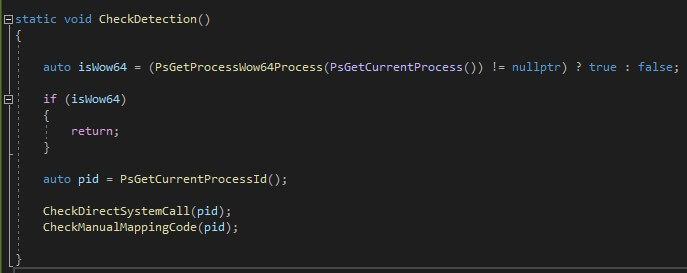
We are going to apply the same idea suggested in the previous article, but in our case we will monitor each system call of each process from the kernel instead of a single process.
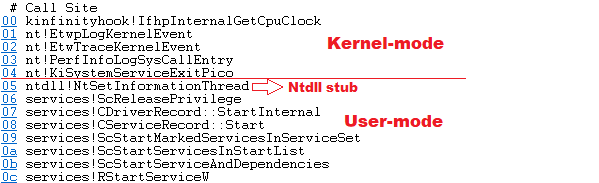
To understand the detection logic we have to know that system calls are made from specific stubs in the system such as win32u.dll or ntdlll.dll. As an example we are going to show a syscall exported by ntoskrnl and made from ntdll:
Knowing this, the idea to detect Direct System Calls is easy: detect all system calls that are made from modules that are not the stubs designed for them. For simplicity of the analysis, we will focus on ntoskrnl syscalls and in 64-bit native processes. So let’s take a look at the steps to follow to implement our code.
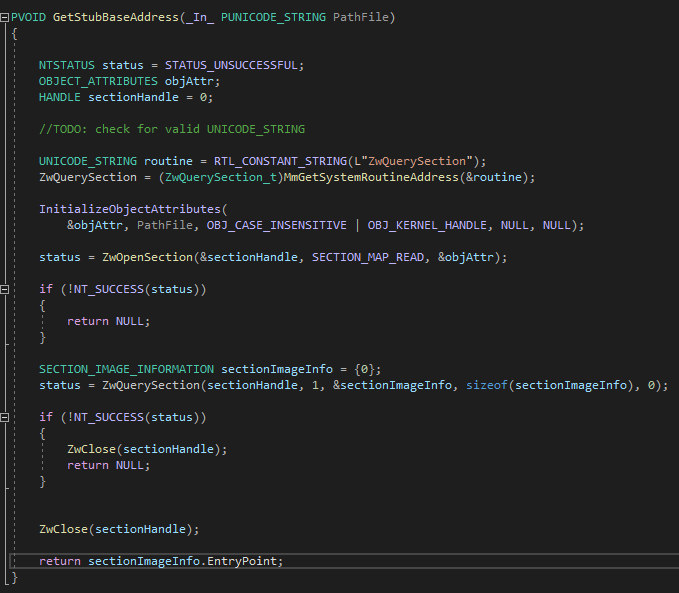
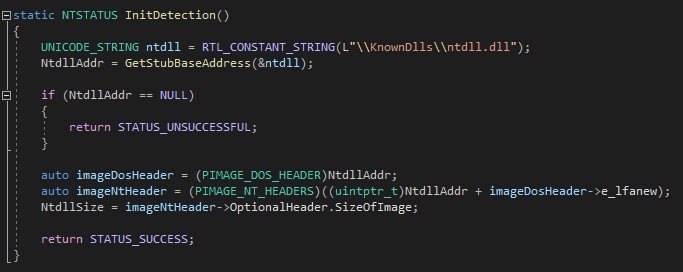
To determine if the system call was made from outside ntdll, we need to know what is the memory address where ntdll is mapped into the processes. (Since ntdll is mapped at a single location for all processes for a given boot). There are several documented methods for resolving the base address of ntdll from the kernel. We will get the memory address through the Section Object:
Once the base address of ntdll is obtained we will calculate the memory mapped size of ntdll to verify later if the calls are made from within the library:
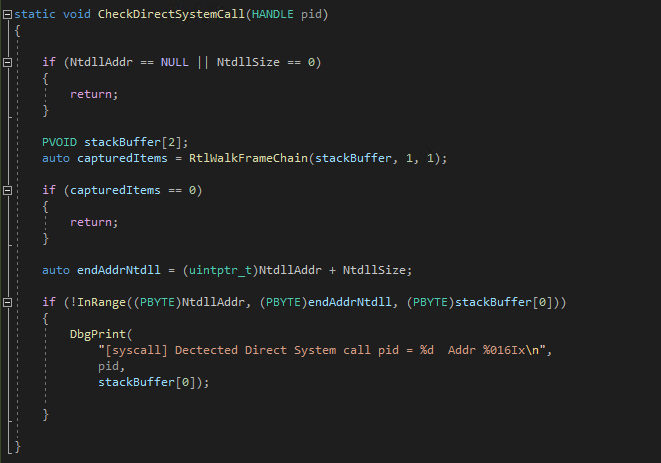
Note that RtlWalkFrameChain function walks the stack and returns the address of the last function call in user-space before jumping to kernel.
To test the detection we will use Dumpert. Dumpert is a Lsass memory dumper which uses Direct System Calls to unhook NtProtectVirtualMemory and NtWriteVirtualMemory functions before dumping the memory of lsass.exe. We can see the detection:
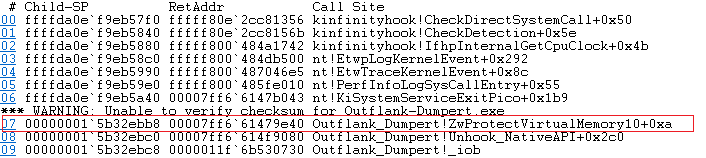
We can see how the syscall was made manually from ZwProtectVirtualMemory10 on Outflank_Dumpert.exe
Manual Mapping Detection
Since we have the possibility to monitor system calls from the kernel, another check we can do is to see when a system call comes from a memory region that has been mapped manually. This way we will discover memory regions executing arbitrary code that we have not previously been able to detect during the memory loading process.
For detection we will use the following code:
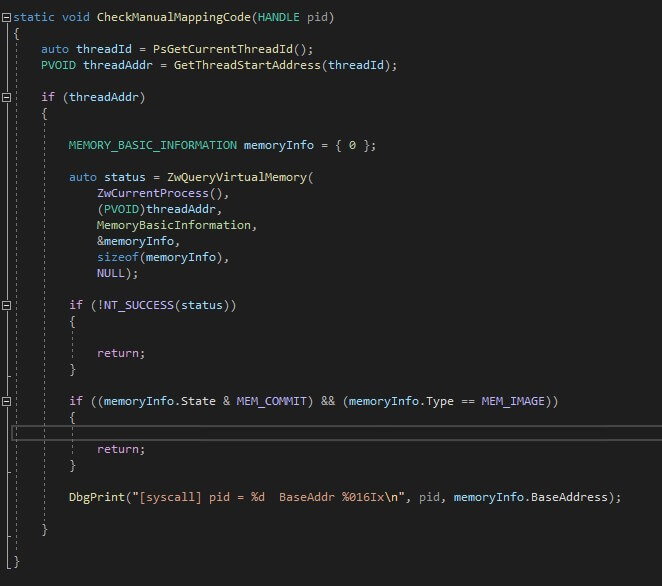
In the above code, we are going to get the base address of the thread that is used to make the syscall and report the detection if the region type is not equal to MEM_IMAGE and the state of the pages is not equal to MEM_COMMIT. Observe that some Hollowing loaders which are able to load the payload as MEM_IMAGE are going to bypass this simple check.
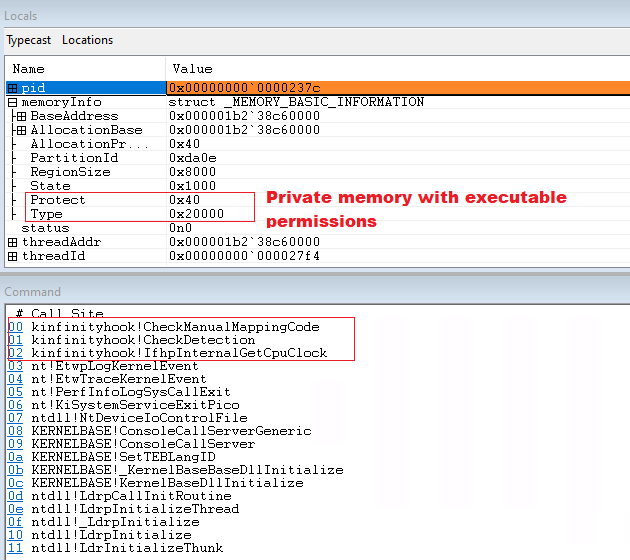
To show the detection we will use a shellcode that does not allocate memory and reuses existing memory to run the payload:
Conclusions
In this blog post, we have tried to show an experimental way to consume syscalls-related ETW events from kernel mode to detect artifacts in memory that are using direct syscalls or manual mapping of code. Note that we are checking for the above-mentioned techniques as an example of detection but detection capabilities can be improved at this point by checking other techniques or memory IOCs.
The suitable situation for this type of detection would be that the operating system would enable callbacks for syscalls monitoring from the kernel without enabling debug mode and porting the code to older builds.

About the Author
Alonso Candado is a security software engineer at CounterCraft where he focuses on low level programming and research of new threats. You can find him on Twitter.